Sarvagya · Saptang Labs · 2022-23
When 1M+ daily alerts demanded clarity.
AI-powered brand threat monitoring for Saptang Labs, rebuilt around severity so analysts act in seconds.
- Client conversion
- +30%
- Task completion
- +25%
- Development time
- −20%
- Role
- UI/UX Designer
- Timeline
- 3 months, 3 iterations
- Platform
- Enterprise web dashboard
- Sector
- Cybersecurity
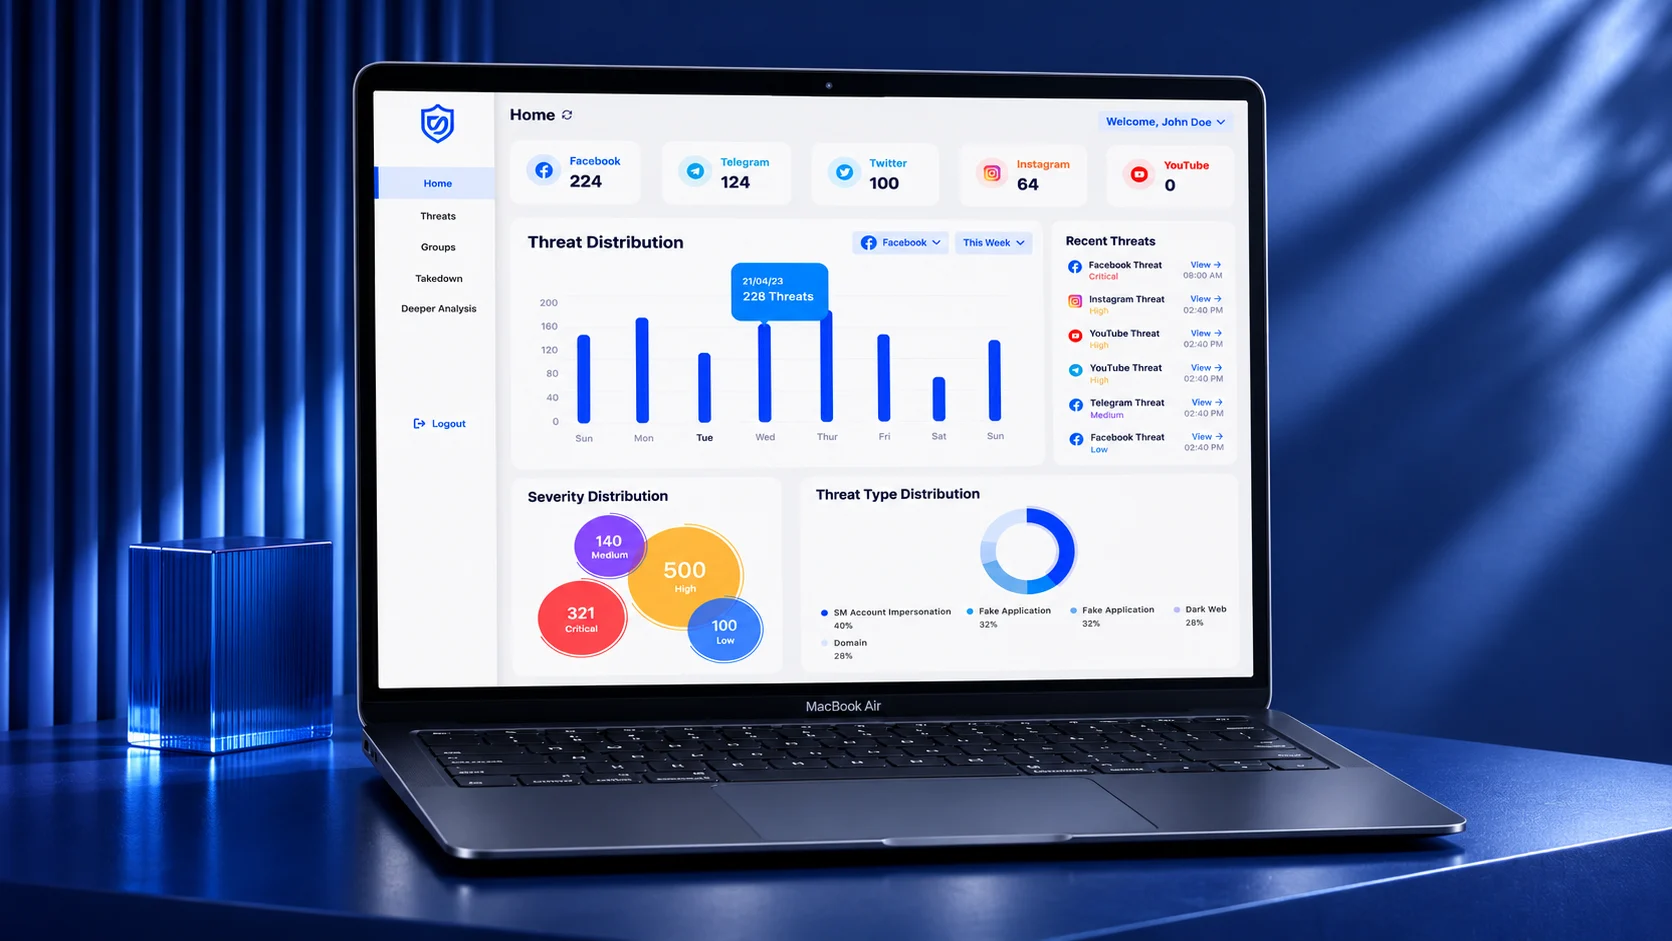
Sarvagya is Saptang Labs' AI-powered platform for monitoring threats to a client's brand across social media and the dark web. Analysts were receiving more than a million alerts a day in dense tables, with nothing to say which mattered first. Over three iterations I moved the product to a visual-first command centre: severity colour, platform cards, and collections for tracking investigations.
- Daily alerts the dashboard has to make sense of
- 1M+Scale
- Client conversion after the dashboard UI iterations
- +30%Result
- Task completion on core threat workflows
- +25%Result
- Development time, from reusable components and specs
- −20%Contribution
Problem
Everything looked equally urgent.
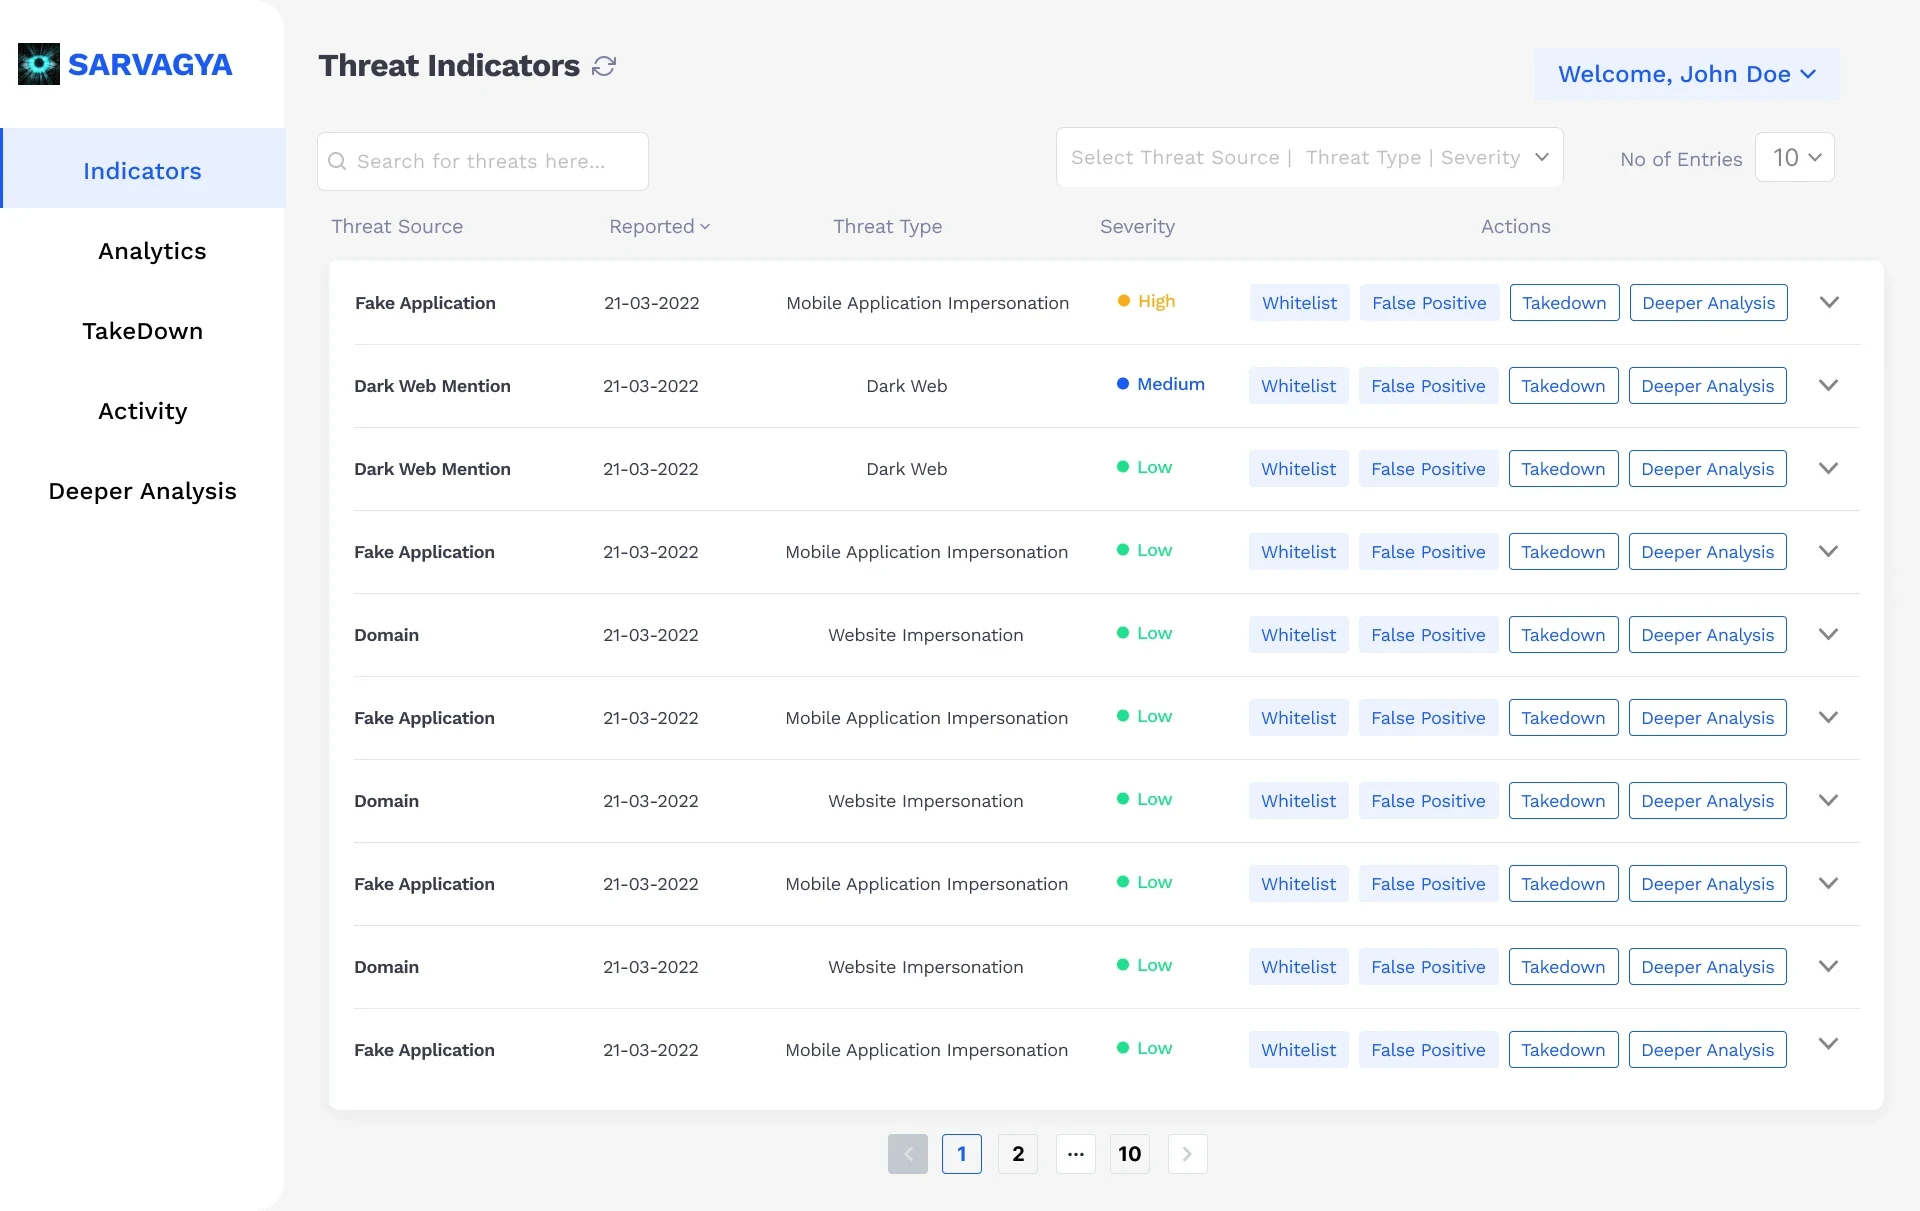
Over a million threat alerts arrived every day. The interface showed them as long tables and blocks of text, so a critical impersonation looked the same as a low-risk mention. Finding the one threat that needed action took too long, and analysts were doing this work under pressure.
- No prioritisation. Severity existed in the data but not in the interface.
- Slow, cluttered views. Dense tables made scanning hard at the moment speed mattered most.
- Strict governance. Role-based access, audit requirements and stakeholder review cycles shaped every pattern.
Primary
Security analysts
Monitor and respond to threats, often against the clock.
Secondary
Managers and executives
Need a high-level view to make strategic calls.
Secondary
Client stakeholders
Judge the product on the business risk it removes.
Research
Talk to the analysts, not only their managers.
I interviewed security analysts directly and ran task analysis on their existing monitoring workflows. Managers described what the product should report; analysts showed what slowed them down.
Iterations
Three passes, each driven by feedback.
- Pass 1
Visual-first overview
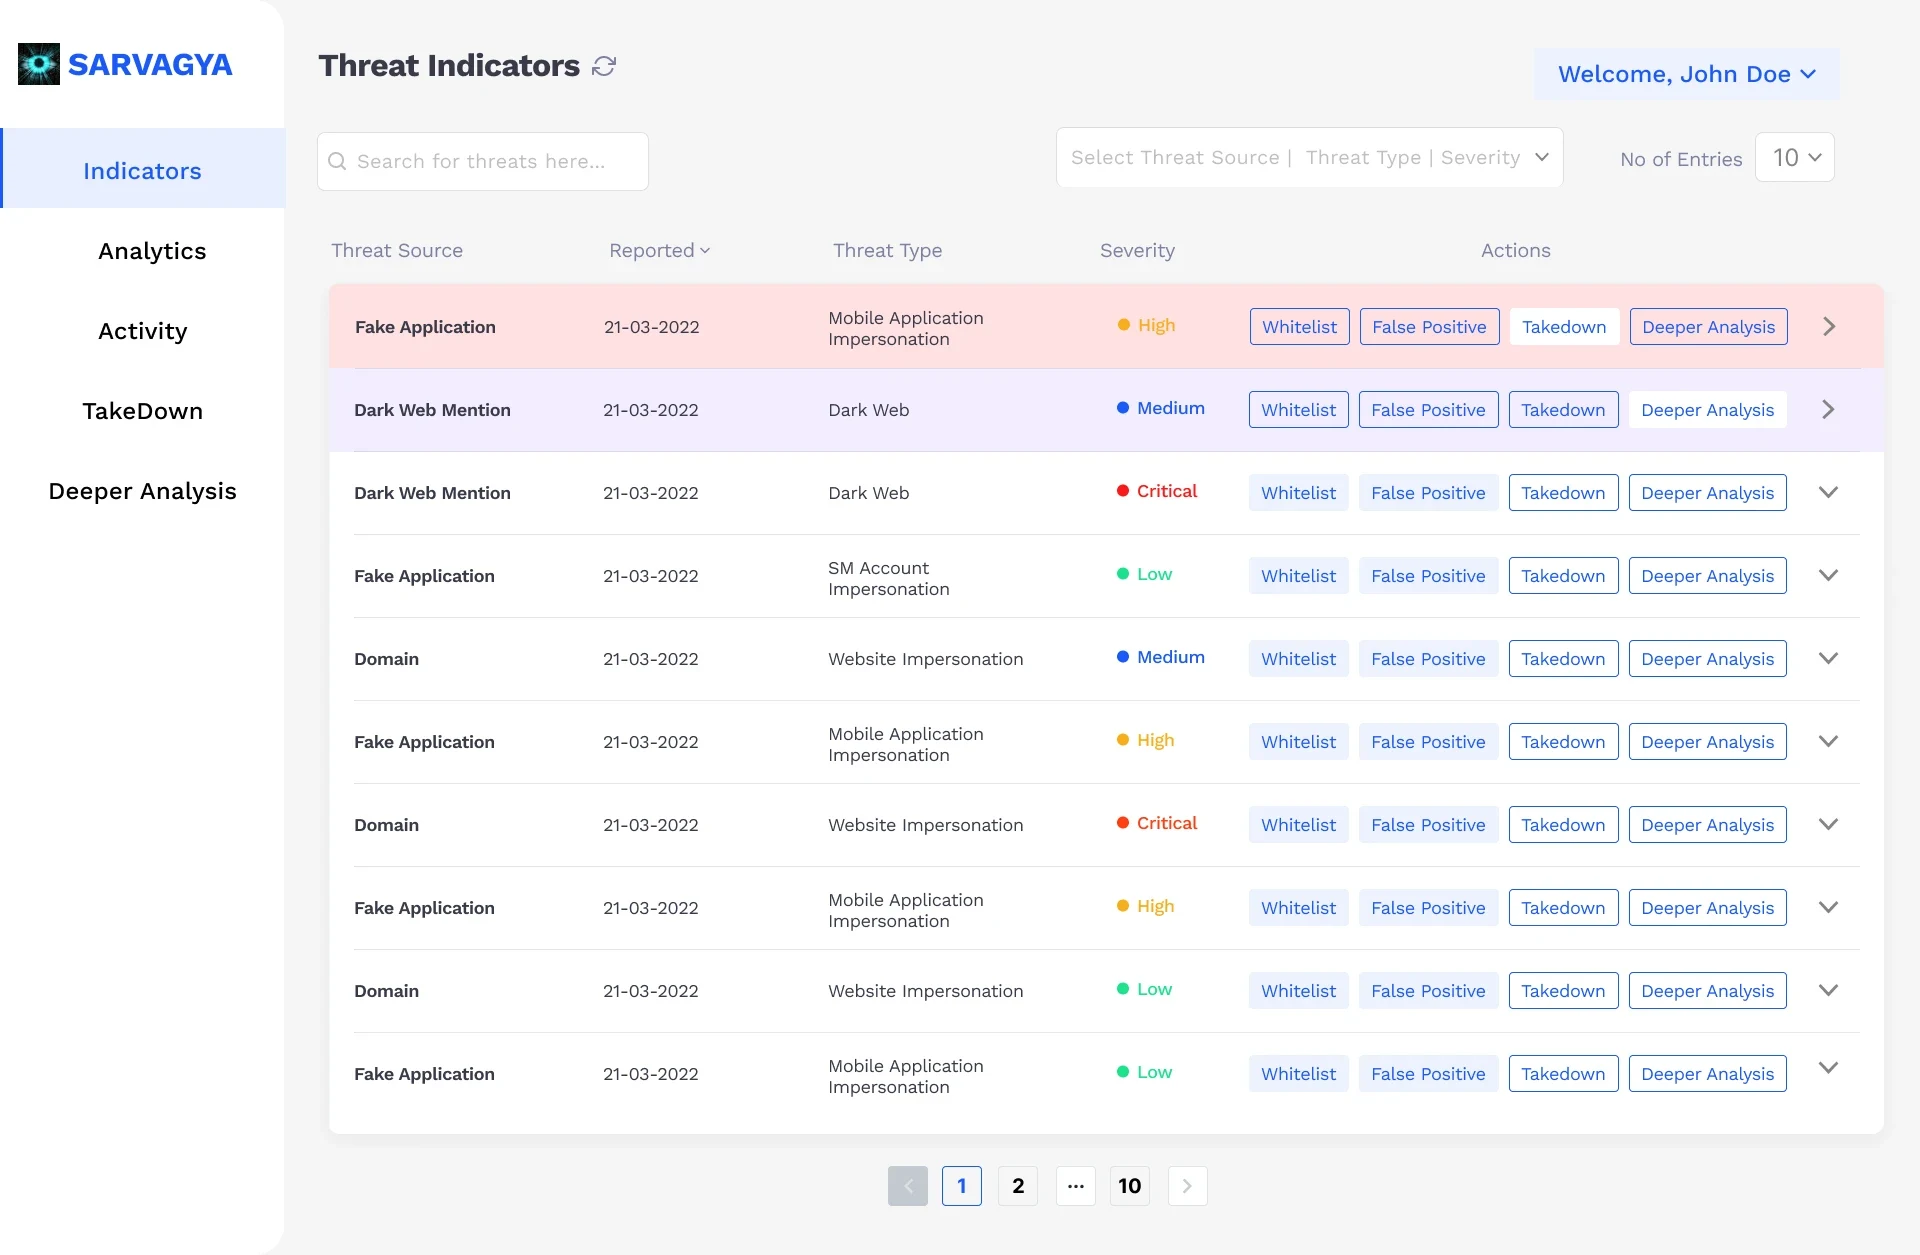
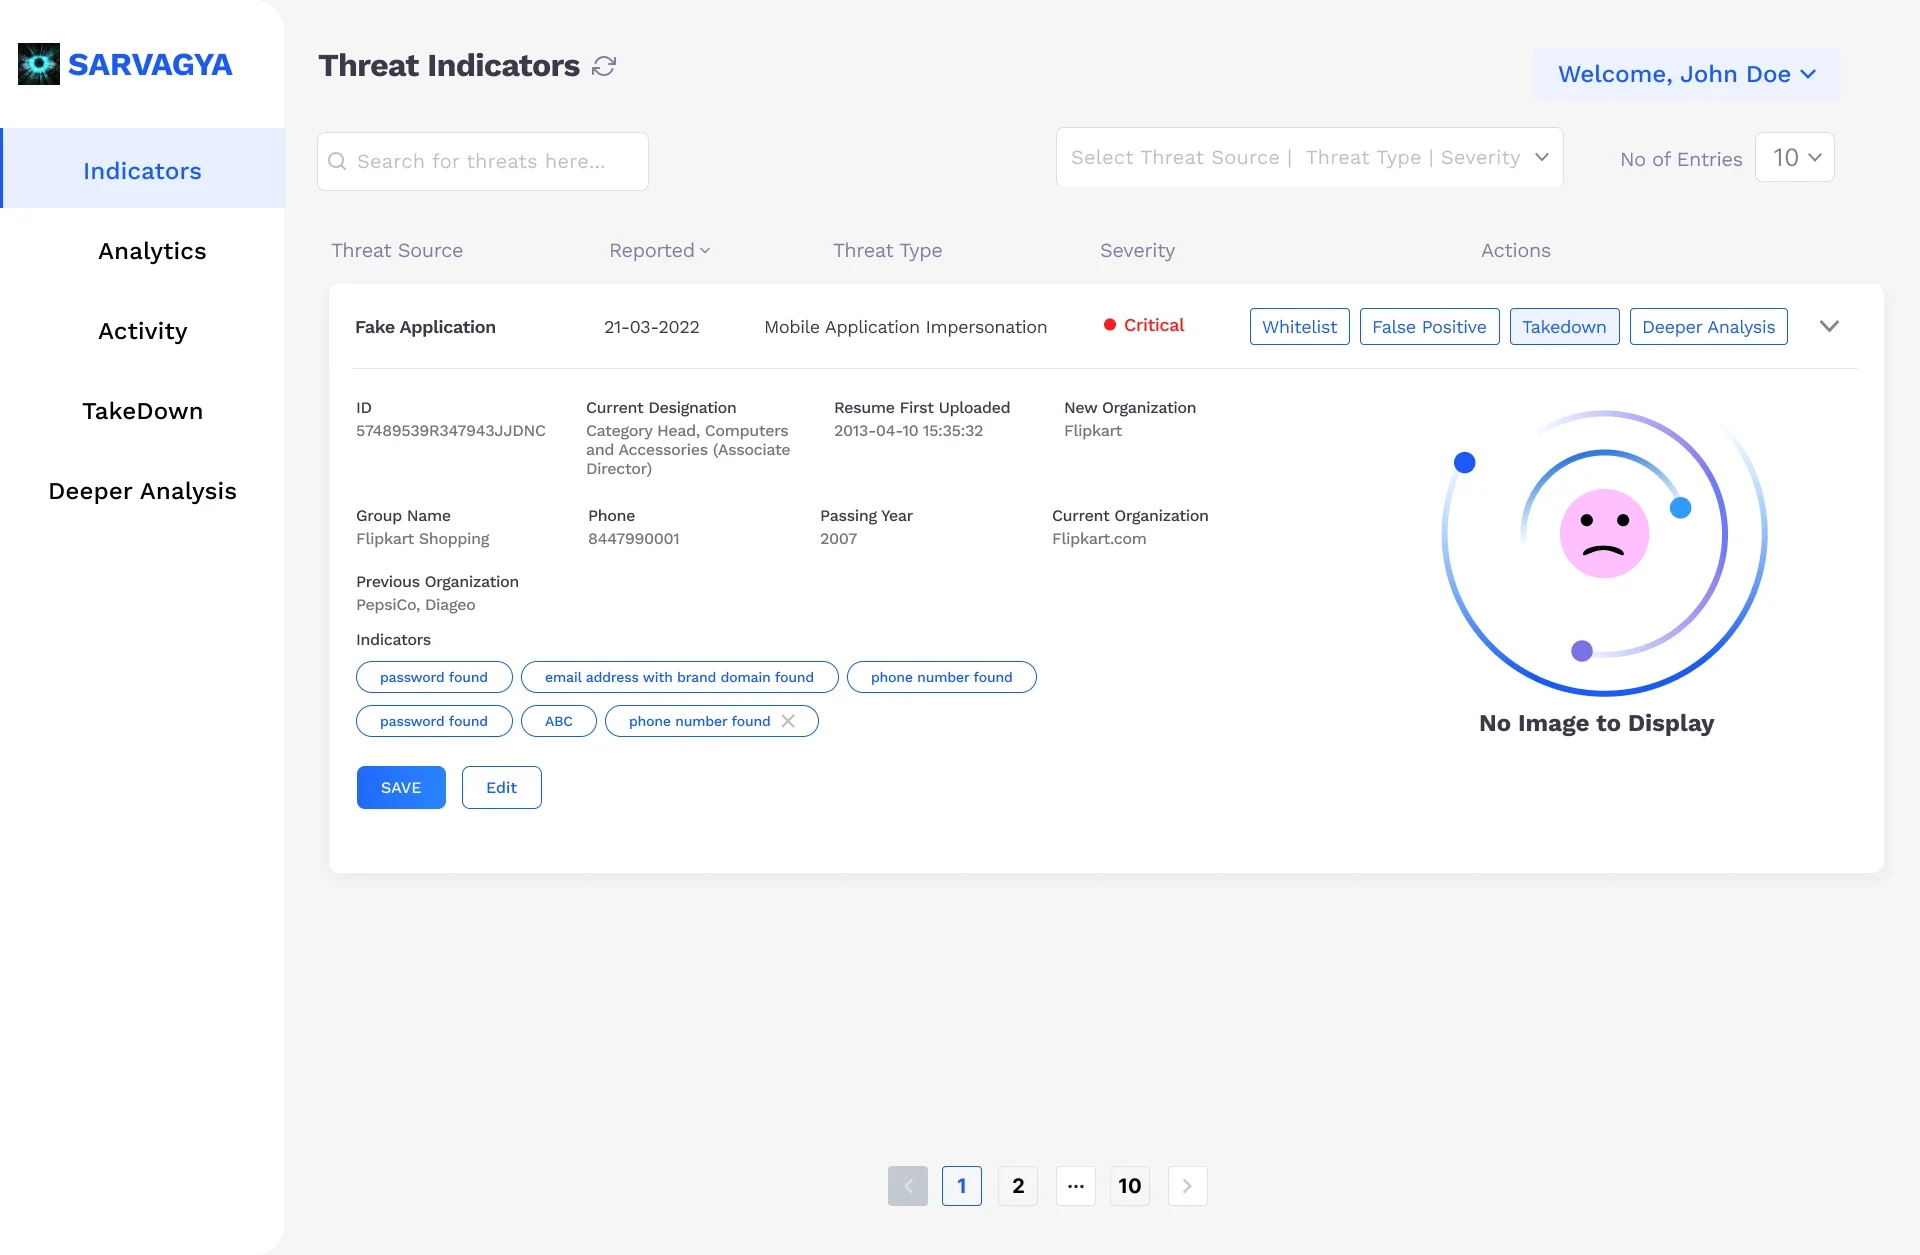
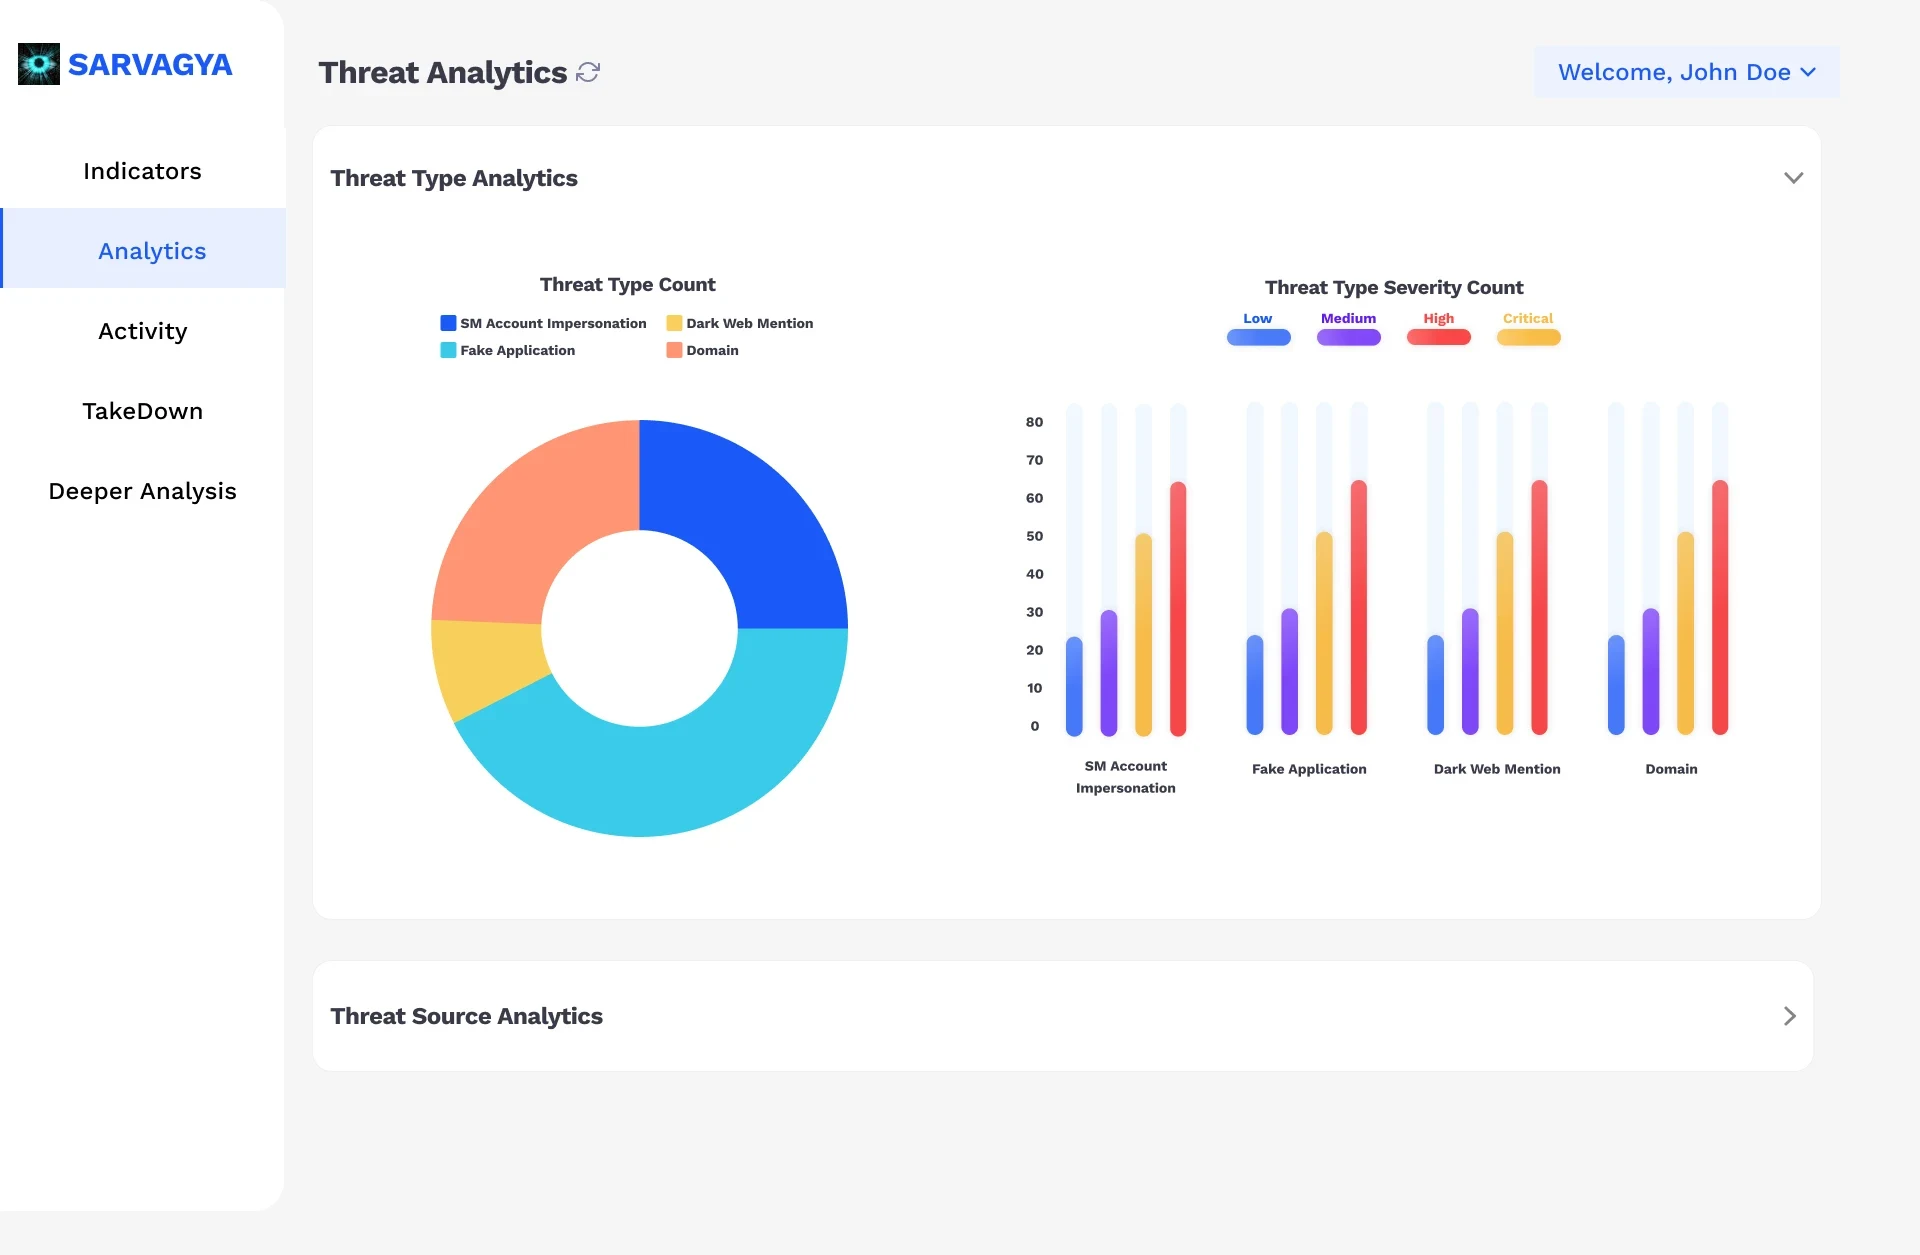
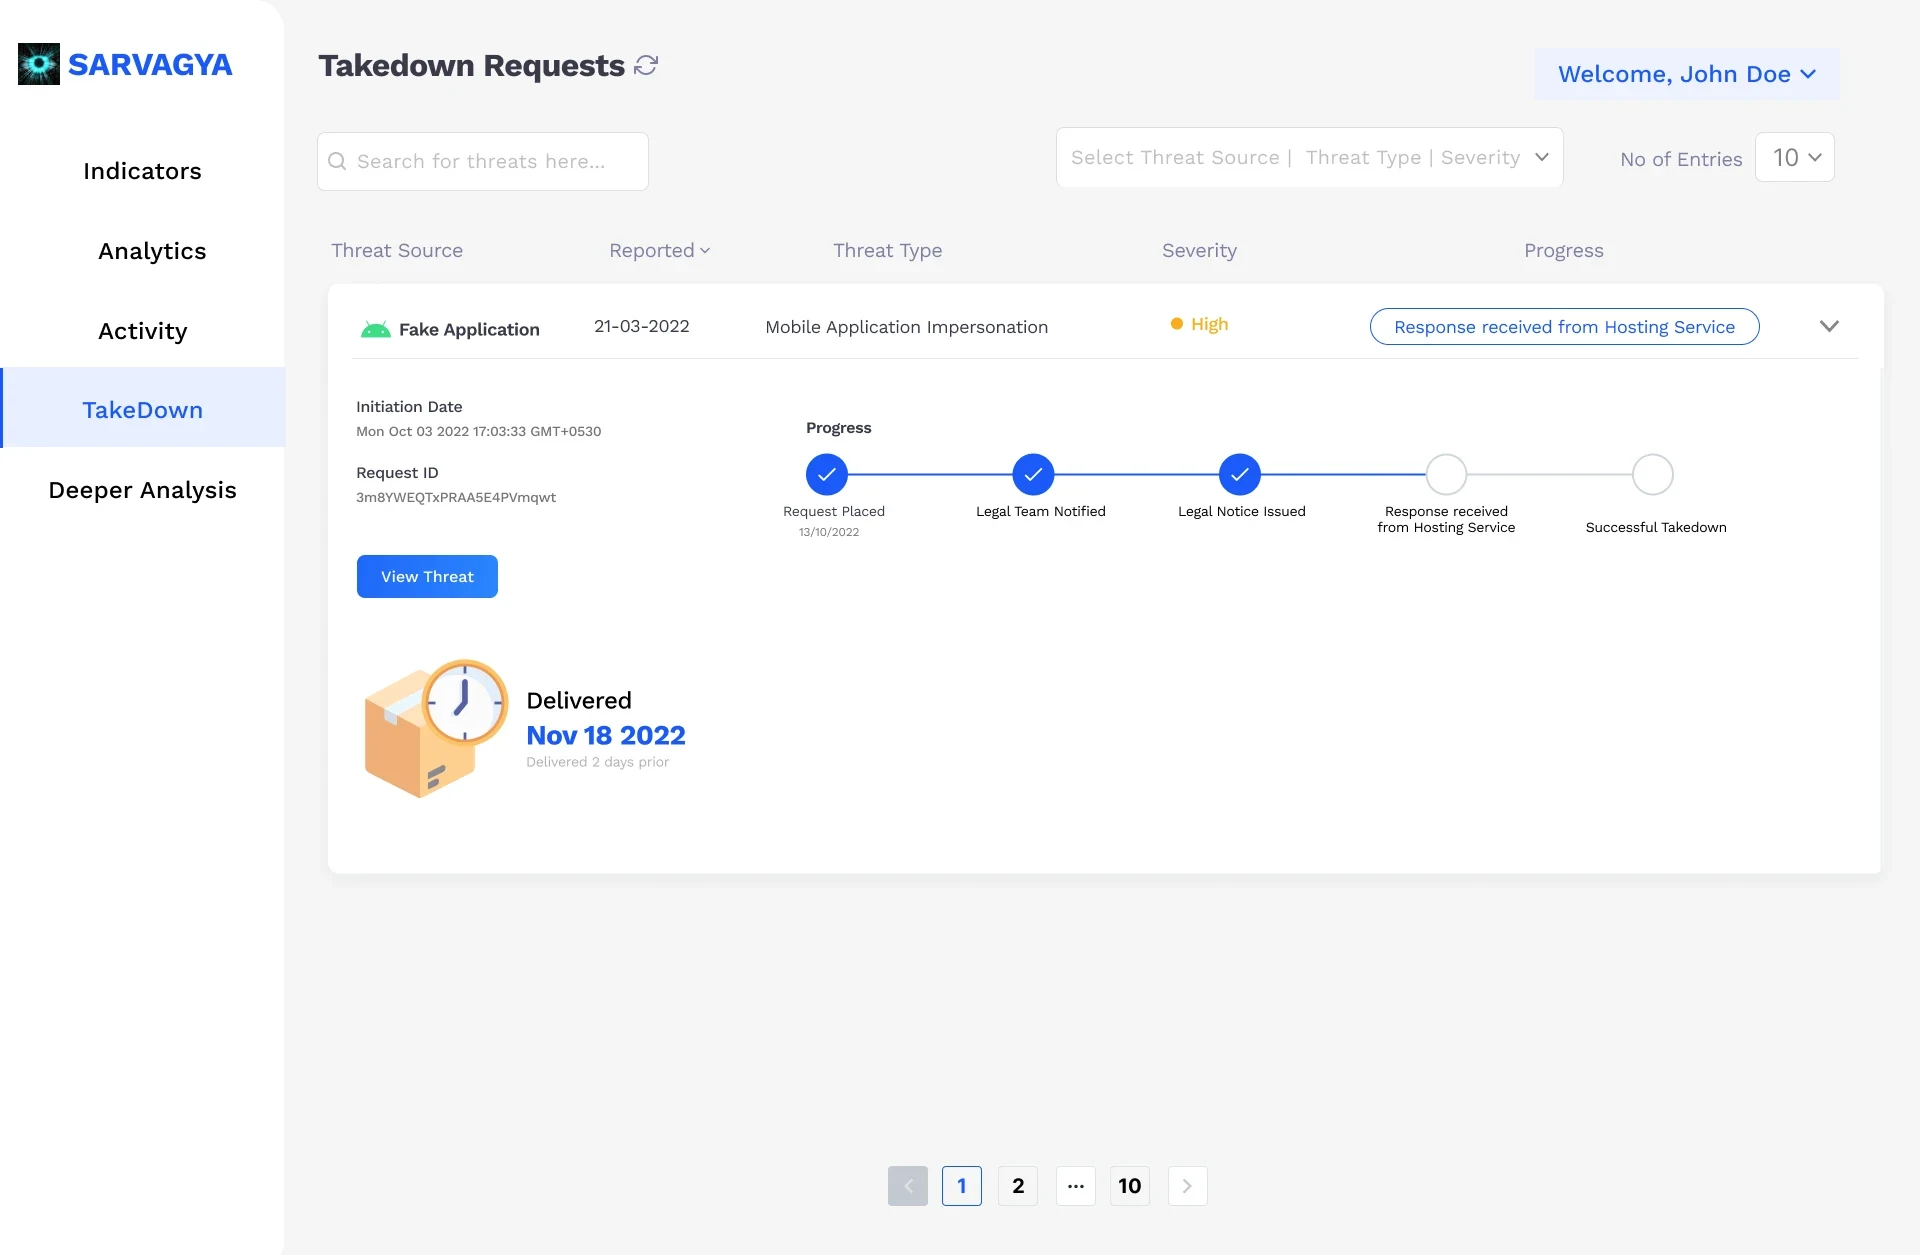
Replaced dense tables with a Threat Command Centre: colour-coded severity (Critical, High, Medium, Low), a donut chart for threat types and a bar chart for severity, filters, a threat detail view and a takedown tracker.
- Pass 2
Navigation and speed
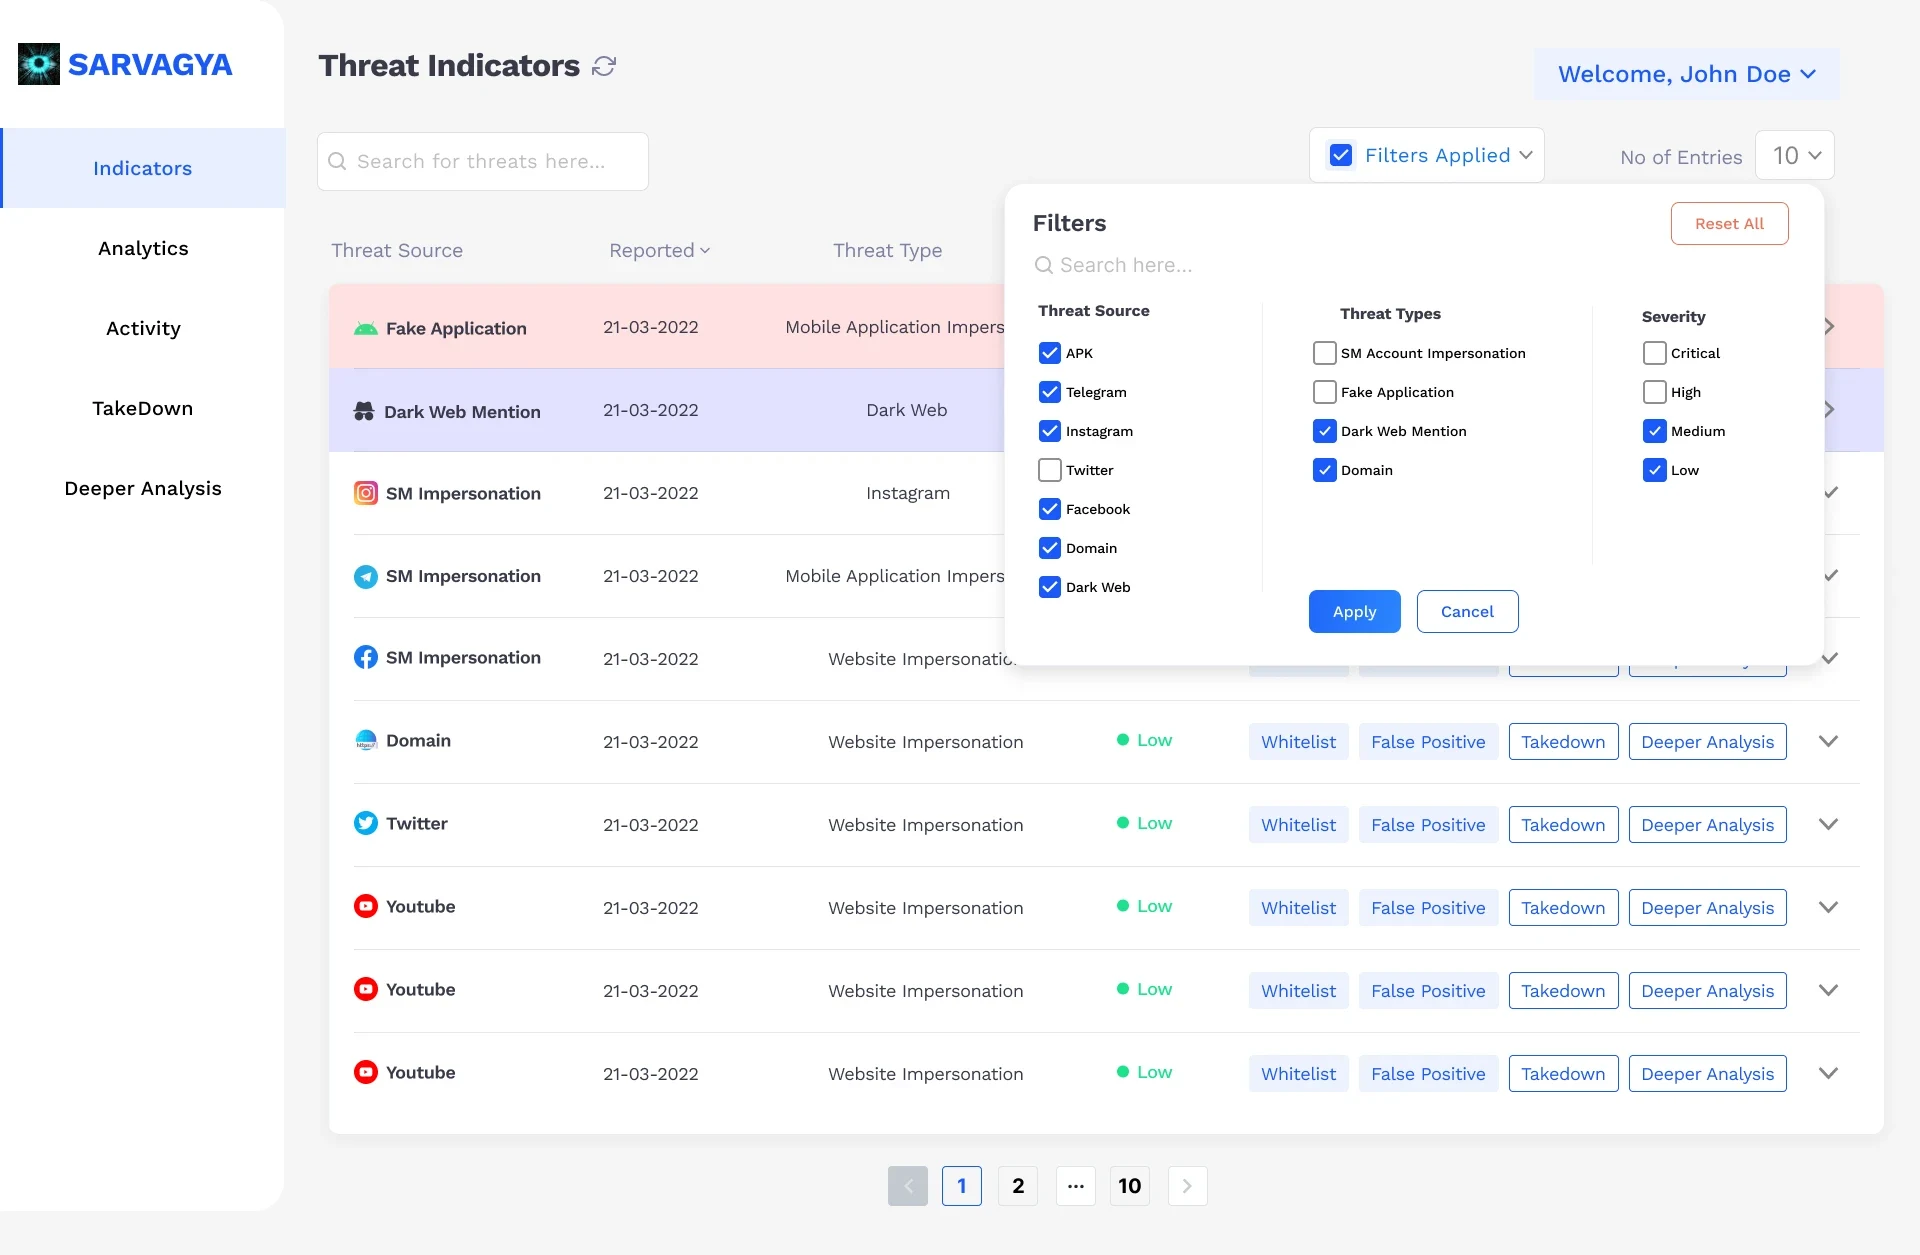
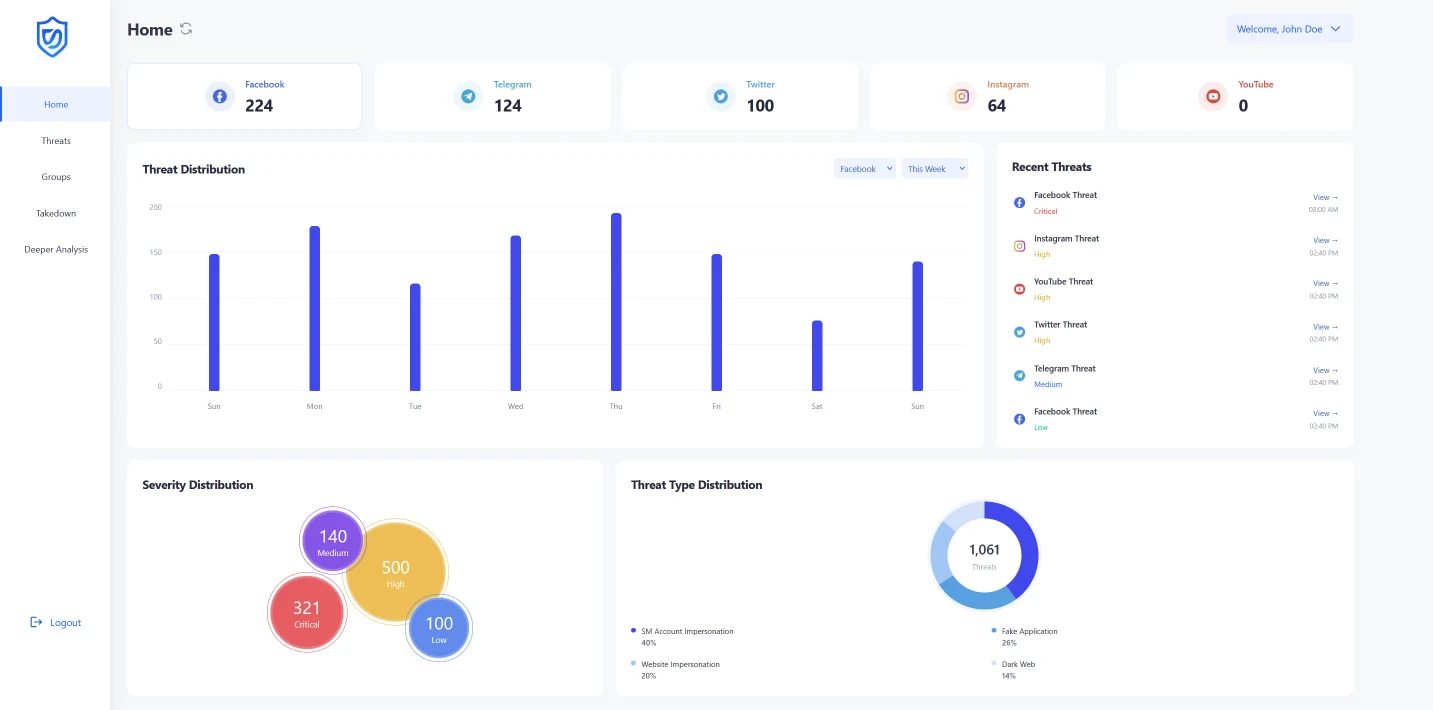
Client feedback: filtering through hundreds of threats was still slow. I added platform-specific threat cards with source branding (Facebook, Twitter, Instagram, dark web), so one click narrows the view.
Fewer filters, faster triage.
- Pass 3
Workflow and organisation
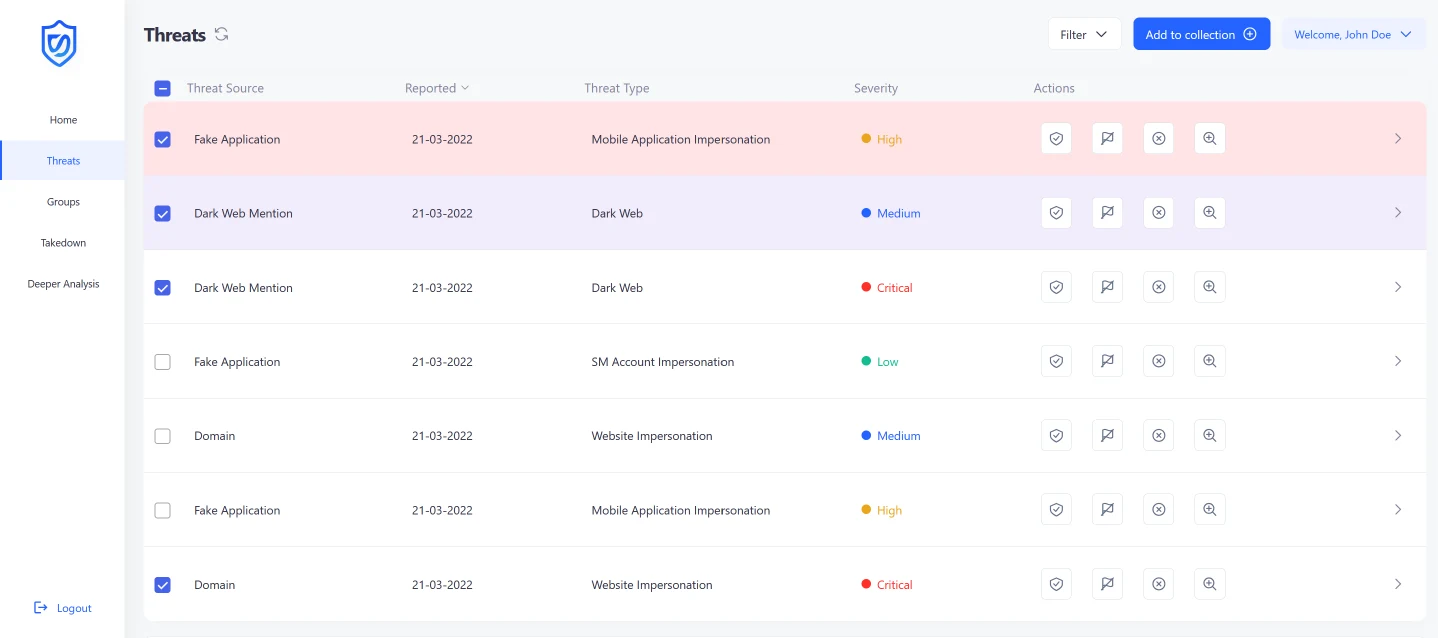
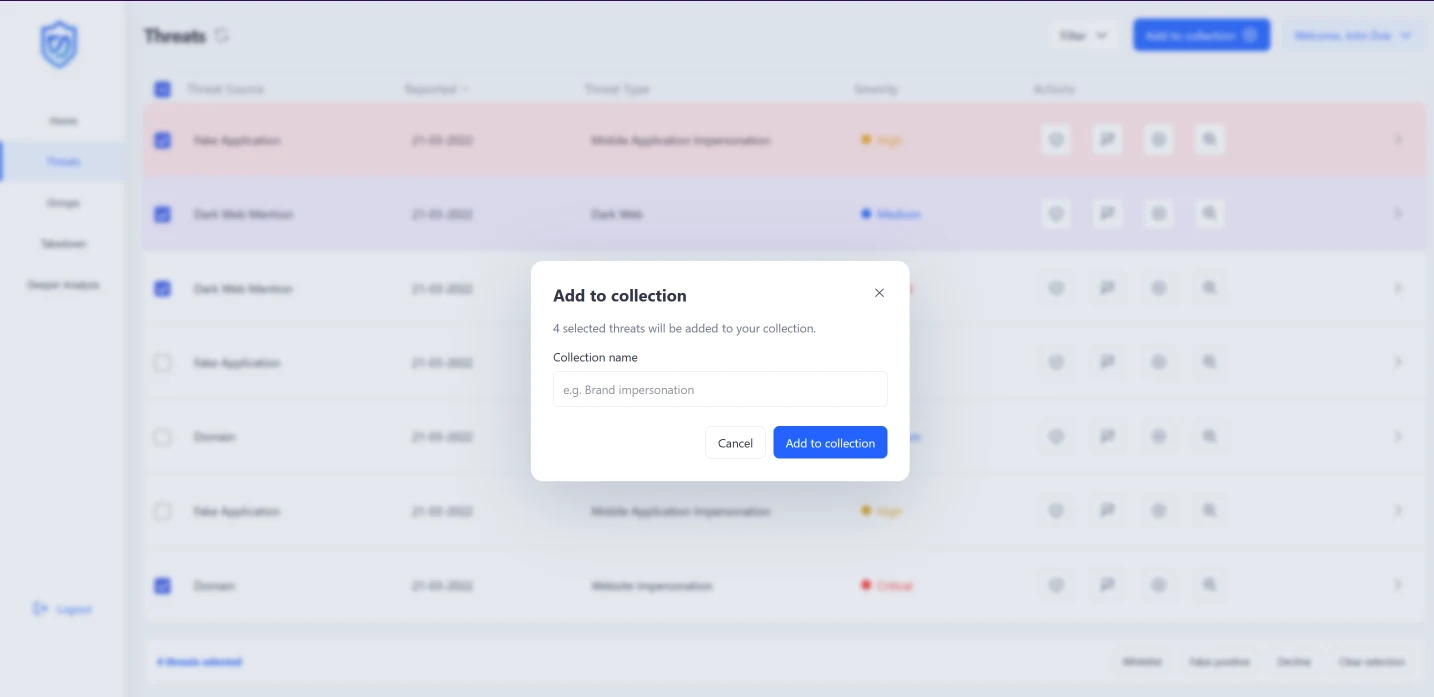
Analysts needed to group related threats during complex investigations. I added bulk selection, an Add to Collection action with custom names, and a Groups page showing each collection's threat count and last update.
Investigations stay together.
System
Components first, so the next screen is faster.
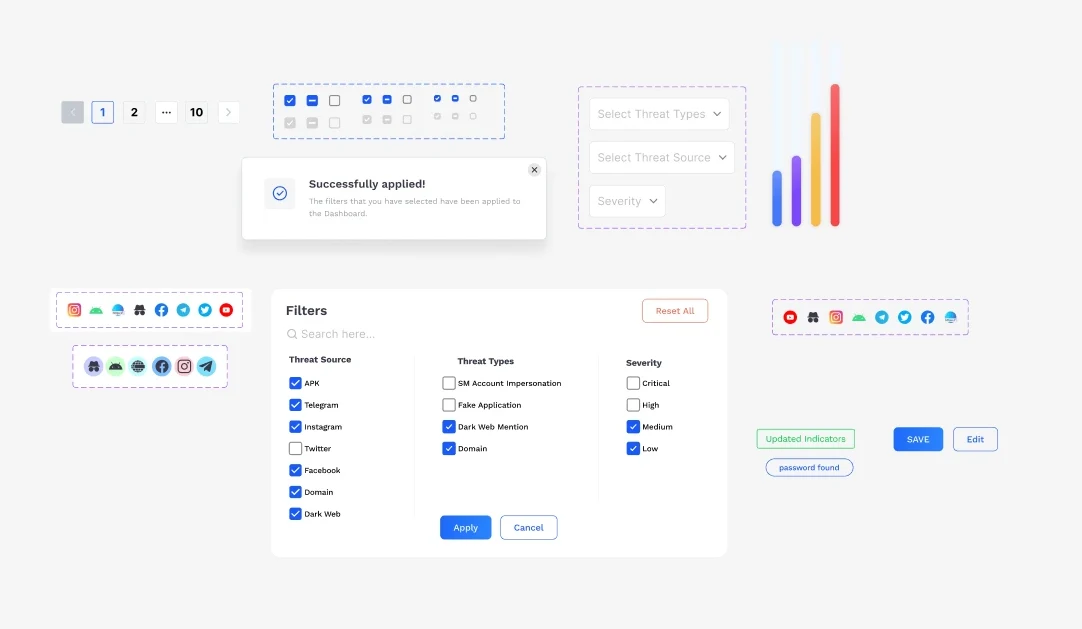
Alongside the screens I built reusable components and design specs aligned with the platform's guidelines, and paired with other designers during prototyping. Engineering could assemble new views from known parts instead of interpreting one-off mockups.
Outcome
Seconds, not minutes.
The iterative dashboard work coincided with a 30% rise in client conversion and a 25% rise in task completion, and the component library cut development time by about 20%. Visuals here are shared selectively because the product is confidential.
Reflection
What I would do differently.
- Interview more analysts, earlier. The biggest shifts came from analyst feedback that arrived mid-project.
- Load-test the design. Layouts that work with 50 rows behave differently with a million data points behind them.
- Start with the design system. It paid off late; it would have paid off more from day one.
Ideas for what comes next: predictive threat analysis, a shared “war room” for major incidents, an executive view that translates threats into business impact, and a mobile app for one-tap takedowns.